OpenDSS Converter
OpenDSS simulates powerflow through an electrical network for steady-state loading conditions. The simulations can then be used to determine electrical infrastructure performance and potential shortcomings for different district design scenarios.
Installation
Run the following URBANopt CLI command to install Python and the required OpenDSS-related dependencies:
uo install_python
Usage
The DiTTo-Reader/OpenDSS workflow is available via the opendss URBANopt CLI command.
For in-terminal help:
uo opendss --help
An example:
- Create an electrical project by including the
-lflag:uo create --project-folder <path/to/electrical/folder> --electric - Run the project as you normally would, being sure you use the electrical feature file, and a scenario file created from it:
uo run --feature <path/to/electrical/featurefile.json> --scenario <path/to/SCENARIOFILE.csv> - Post-process using the default post-processor to generate the feature_reports used by the OpenDSS workflow:
uo process --default --feature <path/to/FEATUREFILE.json> --scenario <path/to/SCENARIOFILE.csv> -
Use the opendss command to run the opendss workflow. You will need to specify a variety of options, or you can specify the config JSON file where the options are specified. You can access the list of options and guidance with the following command:
uo opendss -hThe CLI options are:
--scenario— Required, Path to scenario csv file--feature— Required, Path to feature json file--equipment— Optional, Path to custom equipment file--reopt— Optional, use to specify a run with additional REopt functionality.--start-date— Optional, Beginning date for OpenDSS analysis. Defaults to beginning date of simulation period. Format: YYYY/MM/DD--start-time— Optional, Beginning time for OpenDSS analysis. Defaults to 00:00:00 of start_date if specified, otherwise beginning time of simulation period. Format: HH:MM:SS--end-date— Optional, End date for OpenDSS analysis. Defaults to ending date of simulation period. Format: YYYY/MM/DD--end_time— Optional, Ending time for OpenDSS analysis. Defaults to 23:00:00 of end_date if specified, otherwise ending time of simulation period. Format HH:MM:SS.--timestep— Optional, Number of minutes per timestep in the OpenDSS simulation.--upgrade—Optional, Upgrades undersized transformers when set to true. Defaults to false.
An example config JSON file is also available. Note the key names are slightly different than the CLI option names.
Example
opendssCLI call with options:uo opendss --feature <path/to/FEATUREFILE.json> --scenario <path/to/SCENARIOFILE.csv>An example
opendssCLI call using a config JSON file:uo opendss --config path/to/config.json - Post-process using the opendss post-processor to integrate the opendss results into the feature_reports:
uo process --opendss --feature <path/to/FEATUREFILE.json> --scenario <path/to/SCENARIOFILE.csv>
Notes
- The feature file should contain Electrical Connectors and Junctions for a successful OpenDSS run.
- If you want to include reopt results as an input to OpenDSS, make sure to include the –reopt flag when issuing the
opendsscommand. - Once the
opendsscommand has been run, theprocess --opendsscommand can then be run to pull the opendss results back into the URBANopt reports. - Refer to the Getting Started page at any time to view usage examples.
Visit the Getting Started page for detailed usage examples.
Additional Information
OpenDSS
OpenDSS is an open-source tool that is popular for simulating electrical distribution systems. It captures several important components of the electrical infrastructure which connects substations to customers; including power lines, electrical nodes, loads, transformers, PV systems, capacitors and regulators among others. OpenDSS simulates powerflow through an electrical network for steady-state loading conditions. The simulations can then be used to determine electrical infrastructure performance and potential shortcomings for different district design scenarios. The URBANopt™ framework currently focuses on four key metrics; transformer overloads, line overloads, over-voltages and under-voltages. Simulated electrical behavior outside of industry standards is used to flag impractical district system designs and inform the changes required to achieve more reliable electrical operations.
DiTTo Conversion Tool
There are a variety of modelling tools for representing electrical distribution networks, each of which represents the system in a different way. Some examples of open source and commercial solvers include; OpenDSS, GridLAB-D, CYME, Syneri, DEW, and PowerFactory, among others. Converting between the formats used by these different tools can be a time-intensive and fraught process. The DIstribution Transformation TOol (DiTTo) is an open source and many-to-many conversion tool written in python that has been developed by NLR to simplify converting data between distribution models, and is available on GitHub.
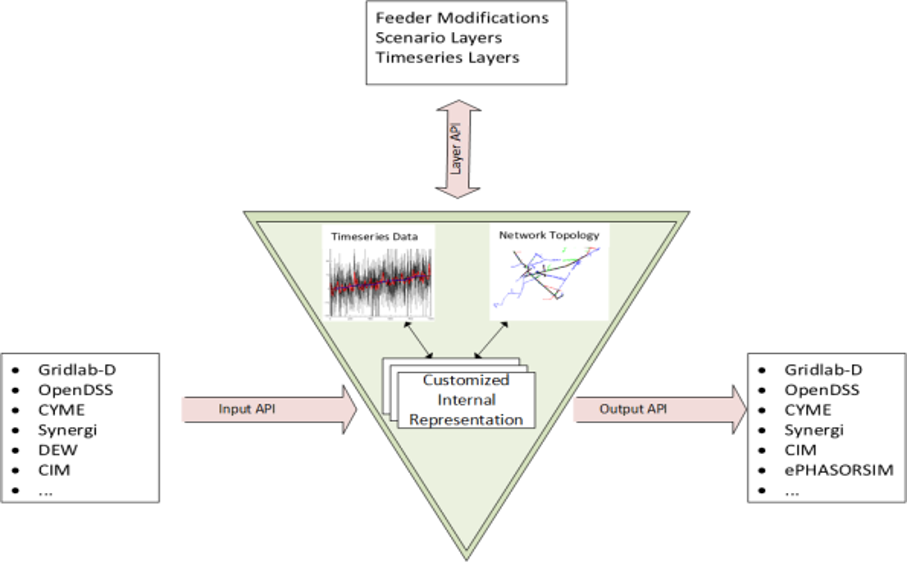
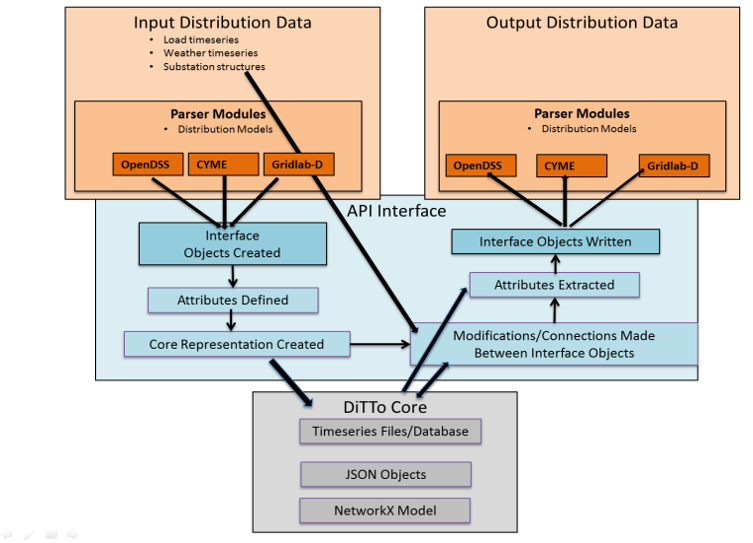
DiTTo contains an application programming interface (API) that characterizes different electrical equipment types (junctions, lines, transformers etc.) and each of their attributes. It also contains functionality to modify and analyze network data once it has been read into the API. DiTTo also contains reader and writer modules which exchange data with the API. A reader module parses data from a model data file and extracts the important network information into the API. A writer module takes the network information from the API and writes a model data file format, so it can be simulated by that electrical modelling tool. The interactions between the reader, writer, and API are shown below.
The DiTTo repository contains an OpenDSS reader and writer to import data from OpenDSS files into the API and to export data in the API to OpenDSS, respectively. However, customized readers and writers can be built to pass data formats that are currently not supported in the DiTTo repository. For URBANopt, geojson files are used to describe district-scale energy system layouts and timeseries csv files are used to describe building load and solar generation profiles.
Conversion Inputs
Geojson data
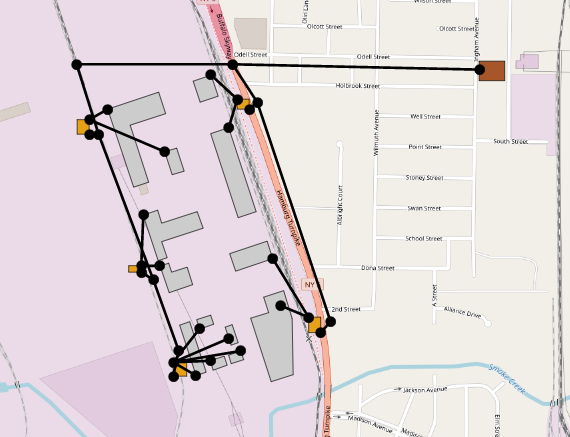
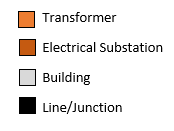
The electrical layout of an URBANopt model is represented in the URBANopt geojson file. Electrical data is represented as part of the district-scale energy system. Currently the electrical equipment of wires, junctions, transformers, capacitors and substations are supported through the URBANopt geojson schema. Electrical equipment can be added to an URBANopt geojson file to represent a potential layout of a district’s electrical distribution system. Equipment identifiers can then be added for transformers, capacitors and lines. The labels describe information such as the type of transformer, or the wire types that are used in the line. An example URBANopt geojson with a substation, lines, and transformers is visualized below below and is included in the example project directory created by uo create --project-folder.
Electrical Database
The URBANopt geojson file does not contain details of the electrical equipment - only equipment identifiers are included. However, OpenDSS requires detailed electrical characteristics for every component in the network (e.g., wire resistance, phase, ampacity GMR, diameter). Key electrical information for several equipment types has been identified in a preliminary json dataset which is included in the urbanopt-ditto-reader repository.
Timeseries Data
URBANopt can be run with a base scenario for each building. Each building feature contains a feature report file titled “default_feature_report.csv”, which contains timeseries information for the district feature including total electricity consumption. This information can be read into DiTTo to provide timeseries loads for the electrical network.
If REopt is used to evaluate behind-the-meter distributed energy resources (e.g., PV and batteries), a separate file titled “feature_report_reopt.csv” is generated for each building feature. This contains timeseries information including total electricity consumption and solar power generation. If the DiTTo converter uses the REopt loads, the updated timeseries dataset is attached to OpenDSS, and PV objects are created as required. This can be seen in the example provided in the urbanopt-ditto-reader repository.
Converting and Running OpenDSS
The urbanopt-ditto-reader contains three pieces:
- Sample data needed to convert an URBANopt scenario into OpenDSS
- The DiTTo module to read the URBANopt format
- A CLI to call the DiTTo modules to perform the conversion, and run OpenDSS with the outputs
A config file may used as an input argument for the CLI and specifies the location of the timeseries load data, equipment file, where the OpenDSS output will be written to, the geojson input file, the location of the DiTTo repository, and whether REopt outputs will be used over the default URBANopt timeseries data. An example is shown below:
{
    "urbanopt_scenario_file": "urbanopt_ditto_reader/example/baseline_scenario.csv",
    "equipment_file": "urbanopt_ditto_reader/electrical_database.json",
    "opendss_folder": "urbanopt_ditto_reader/example/run/baseline_scenario/opendss",
    "urbanopt_geojson_file": "urbanopt_ditto_reader/example/urbanopt_example.json",
    "use_reopt": true,
    "number_of_timepoints": 10
}
The conversion script is then run with
ditto_reader_cli run-opendss -c path/to/config.json
This uses the reader module to convert the URBANopt data into OpenDSS files, which are written in the opendss_folder location from in the config file. The subfolder dss_files contains the .dss files required to run OpenDSS and the subfolder profiles contains simplified timeseries data required to run OpenDSS.
OpenDSS is then run using the python OpenDSSDirect module, which runs powerflow for the network created from the input files. The results of the simulation are written the the results subfolder of the opendss_folder directory.
Output Data
OpenDSS contains a wealth of information about the electrical network and what the state of all the devices on the network are at different time steps during the simulation. The urbanopt-ditto-reader module focuses on:
- Line overloads
- Transformer overloads
- Over-voltages and under-voltages at building features
Overloads are observed when a wire or transformer is over 100% of its rated capacity. An overvoltage is a per-unit voltage greater than 1.05, while an undervoltage is a per-unit voltage below 0.95, as per ANSI standards.
In the results folder there are folders for Transformers, Lines, and Features. Each of these folders contains a csv file titled by the equipment name for each respective equipment type in the network. Transformers and lines contain fields about loading and whether the device is overloaded. Features contain a field about the voltage and whether the device has an overvoltage or undervoltage. For instance the feature file:
Datetime,p.u. voltage,overvoltage,undervoltage
2019/01/01 01:00:00,0.94,False,True
2019/01/01 02:00:00,0.97,False,False
2019/01/01 03:00:00,1.0,False,False
2019/01/01 04:00:00,1.03,False,False
2019/01/01 05:00:00,1.06,True,False
2019/01/01 06:00:00,1.07,True,False
indicates that at 01:00, there is an undervoltage detected, while at 5:00 and 6:00 overvoltages are detected. This information is integrated into the default URBANopt reports via the OpenDSS postprocessor. The updated reports can be used for identifying district-scale energy systems which may need to be re-designed.